Betting Experience is not just forecasts and statistics, but much more. It provides you with a series of interesting views to find the games that can be most profitable in terms of payout percentages.
And the screenshots of Valuebets and Real Odds are a great help in trying to find the advantageous odds configurations that the schedule offers.
The ValueBet
We know that bookmakers tend to offer odds that are certainly to their advantage and that move following the movements of the market. Our algorithms try to find situations where the offered odds may be their “mistake”.
The screen looks like this (for the mobile version):
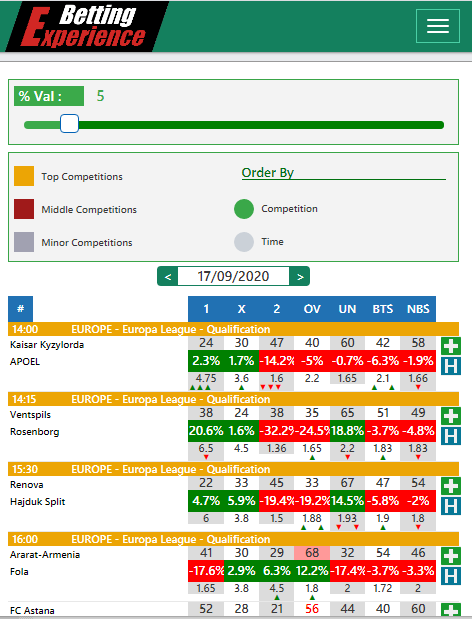
Our algorithms produce a prediction of the various signs. This screen compares the percentage of exit of the sign calculated by us with the odds offered by the bookmakers, indicating whether it is convenient or not. Let’s take an example:

For each single event our screen has 3 values:
-> The first value is the sign exit percentage calculated by our algorithms
-> The third value is the odds offered by the bookmaker
-> The second value is the Valuebet
The central value (the Valuebet) compares the Betting Experience value and the bookmaker’s value and provides a percentage, which represents the “gain” or “loss” in value of the odds offered by the books. With the same criteria as the bookmaker, we also calculate a “virtual odds” and compare it with that offered. The resulting percentage is the difference in value between these two.
If the percentage is negative, it means that the book has offered a lower odds than the value of the bet.
If, on the other hand, the percentage is positive, the offered share of the book is advantageous and is high compared to the probability of exit calculated by us!
Bookmakers decrease their odds by a percentage from which their profit derives. Imagining that for a match the home team has a 50% chance, we will not find an even-money odds (2), but an odds lowered by a fixed percentage (e.g. 1.85). For this reason it is very difficult to find “wrong” odds, where the book has kept the odds high.
The Real Odds
The real odds screen allows you to see the same information on the odds comparison from another point of view, making a comparison between the odds offered by the bookmaker and the hypothetical “real” odds, calculated by our algorithms.
The screen looks like this:

For each game there is a comparison between the odds offered by the bookmaker and the odds calculated by our algorithms, the games where our calculated odds are lower than those of the bookmaker, and therefore their most advantageous odds, mark in green. Let’s take the same example as before, in order to understand the concept:

-> The first value is the sign exit percentage calculated by our algorithms
-> The second value is the odds calculated by our algorithms
-> The third value is the odds offered by the bookmaker
If the odds are in red, it means that the book has offered a lower odds than the value of the event.
If, on the other hand, the share is in green, the share offered by the book is advantageous and is high compared to the real share of the event!
As mentioned earlier, bookmakers tend to lower their odds as a percentage to make a profit from their odds offer. In calculating our odds, to be realistic, we do the same: we simulate being a bookmaker and insert our virtual earnings in our odds, so that the odds we provide are as realistic as possible.